Language Analyses
In this section you will find some insights about language usage in Switzerland
In 2015, 63.0% native speakers of German (of which 59.5% speak Swiss German and 10.4% Standard German at home); 22.7% French (mostly Swiss French, but including some Arpitan dialects); 8.4% Italian (mostly Swiss Italian, but including Lombard dialects); and 0.6% Romansh. [Wikipedia]
| Language | Mother Lang |
Main Lang |
||
|---|---|---|---|---|
| German | 4,639k | 63.66% | 4,348k | 64.47% |
| French | 1,484k | 20.37% | 1,525k | 22.61% |
| Italian | 470,961 | 6.46% | 561,857 | 8.33% |
| Romansch | 35,072 | 0.48% | 35,753 | 0.53% |
| Serbo-Croatian | 103,350 | 1.42% | 168,422 | 2.50% |
| Albanian | 94,937 | 1.3% | 176,293 | 2.61% |
| Portuguese | 89,527 | 1.23% | 238,327 | 3.53% |
| Spanish | 76,750 | 1.05% | 150,782 | 2.24% |
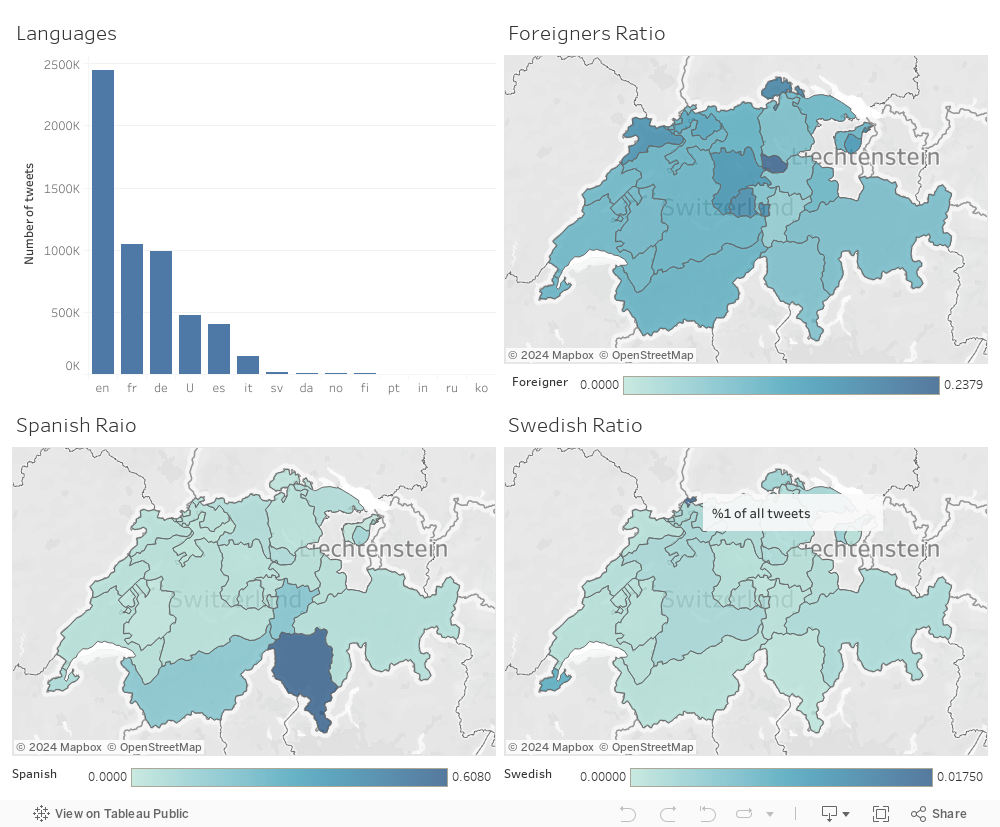
| English | 73,422 | 1.01% | 316,830 | 4.70% |
| Turkish | 44,523 | 0.61% | 76,379 | 1.13% |
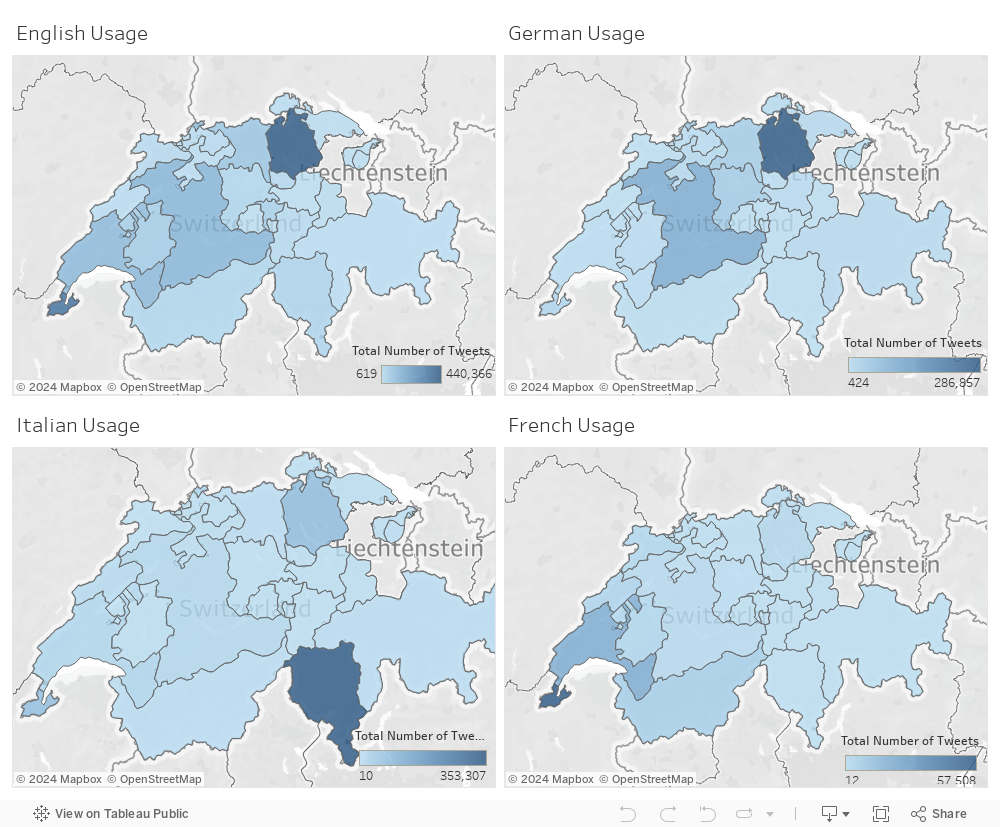
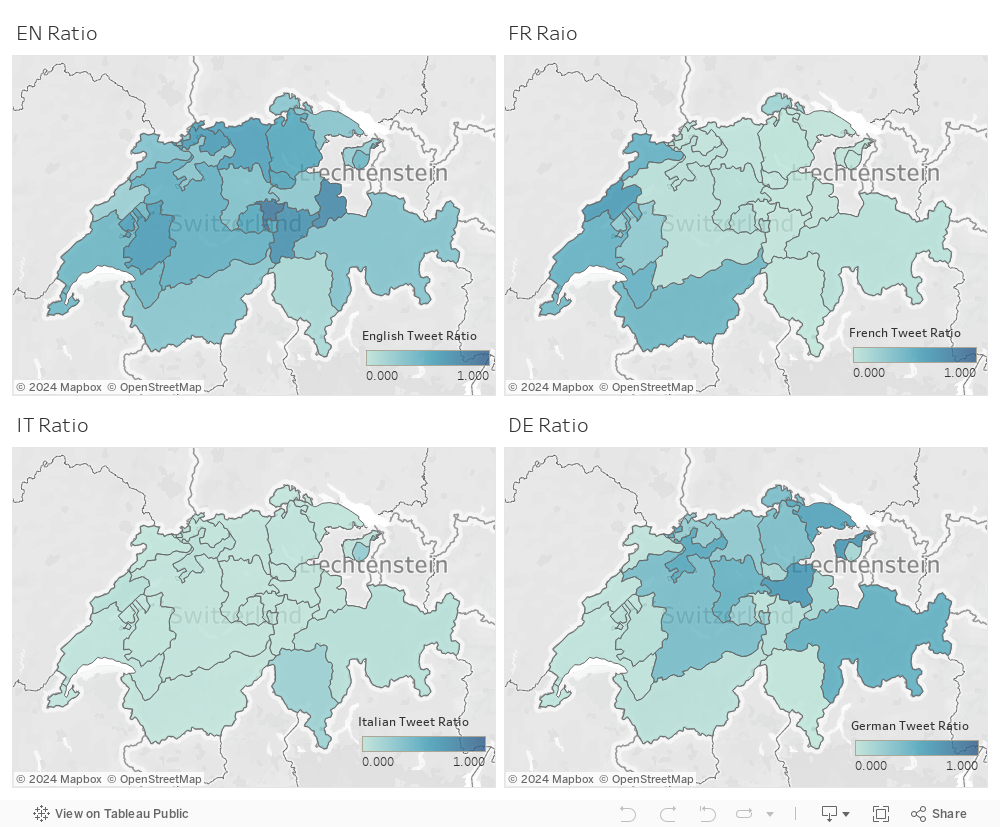
The German region (Deutschschweiz) is roughly in the east, north and center; the French part (la Romandie) in the west and the Italian area (Svizzera italiana) in the south. There remains a small Romansh-speaking native population in Graubünden in the east. The cantons of Fribourg, Bern and Valais are officially bilingual; the canton of Graubünden is officially trilingual.

You will see 4 different map blow. Each one represent one language distribution. In this visualizaion we have used actual tweet counts. So these graphs will be affected by population. Population * language ratio will be in count.